
The Income Conversation Most Agents Avoid
The median licensed villa in Ibiza earned €91,000 gross at four bedrooms and €111,000 at five in the twelve months to August 2026. After running costs of 20% to 40%, and set against today’s purchase prices, net returns sit between 2% and 4%. This article shows where those numbers come from, week by week and area by area, and what separates the villas that keep more.
Every owner who has bought or is considering buying a villa in Ibiza has been shown rental income projections. They tend to look compelling. Strong weekly rates, reasonable occupancy assumptions, and a gross annual figure that appears to justify the acquisition price, or at least come close. What those projections almost never show is what the villa actually nets after the full cost of operating it, taxing it, and maintaining it to the standard required to sustain those income figures year after year.
This is not accidental. Headline income figures are used to sell properties and attract management clients. Net figures, with realistic cost assumptions applied, are less attractive and harder to present optimistically. But net is the only number that actually determines whether a villa makes financial sense as a rental asset in today’s market.
The starting point for any honest performance conversation is resetting expectations away from gross projections and toward what a well-managed, fully compliant villa in a good location can realistically retain after costs. That number is meaningful, but it is not what most owners were shown at the point of purchase, and the gap between expectation and reality is one of the most consistent sources of owner frustration we encounter.
What Ibiza Villas Actually Earn: The Real Range
Average nightly and weekly rates in Ibiza vary enormously depending on location, villa size, quality of management, legal status, and the specific weeks being filled. The ranges below reflect operational reality across the market rather than the top-end figures that tend to dominate marketing materials.
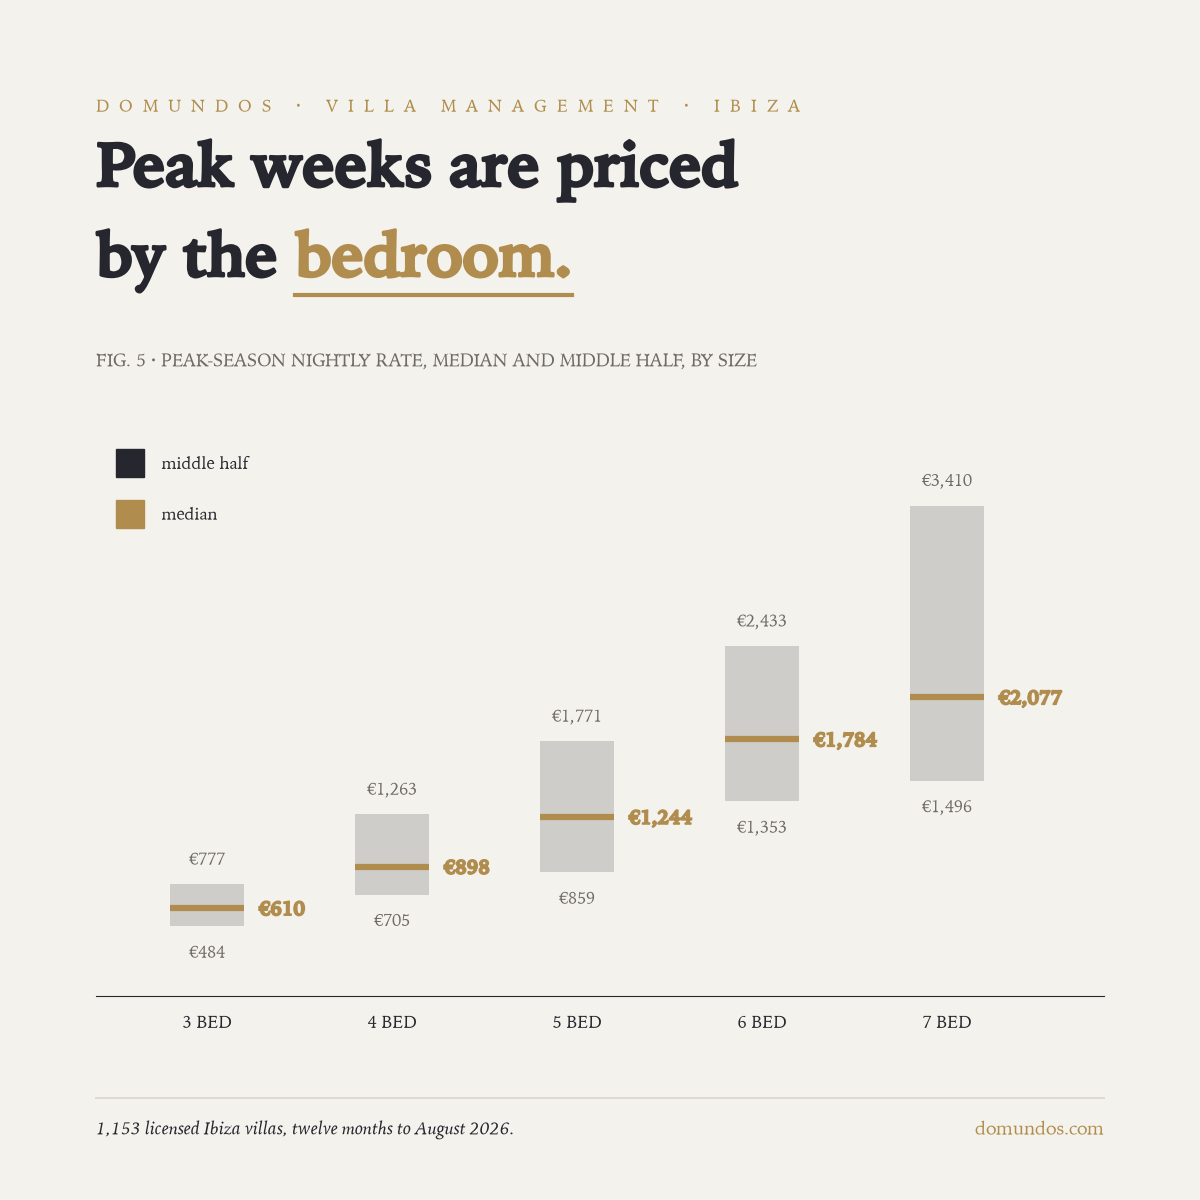
Peak-season nightly rates are set by the bedroom count before anything else. Across the dataset the median peak rate is €610 for 3 bedrooms (middle half €484 to €777), €898 for 4 bedrooms (middle half €705 to €1,263), €1,244 for 5 bedrooms (middle half €859 to €1,771), €1,784 for 6 bedrooms (middle half €1,353 to €2,433), €2,077 for 7 bedrooms (middle half €1,496 to €3,410). The middle half of the market runs from roughly a quarter below those medians to a third or more above them; the top quartile is where presentation, reviews and management show. On our own calendars, peak-summer rates from late June to August run at roughly two to two and a half times shoulder-month levels, which is both the opportunity and the risk of the Ibiza model: capture the peak weeks at full rate and the year works; miss them and it does not.
Occupancy follows a similar seasonal pattern, but with a nuance that headline percentages obscure. A villa that achieves 90% occupancy across June, July, and August but runs at 20% in May and September is not the same business as one that achieves 70% occupancy across a longer window from May through October. The second villa may generate comparable or greater annual income with lower operational intensity, lower wear and tear, and a more manageable cost structure.
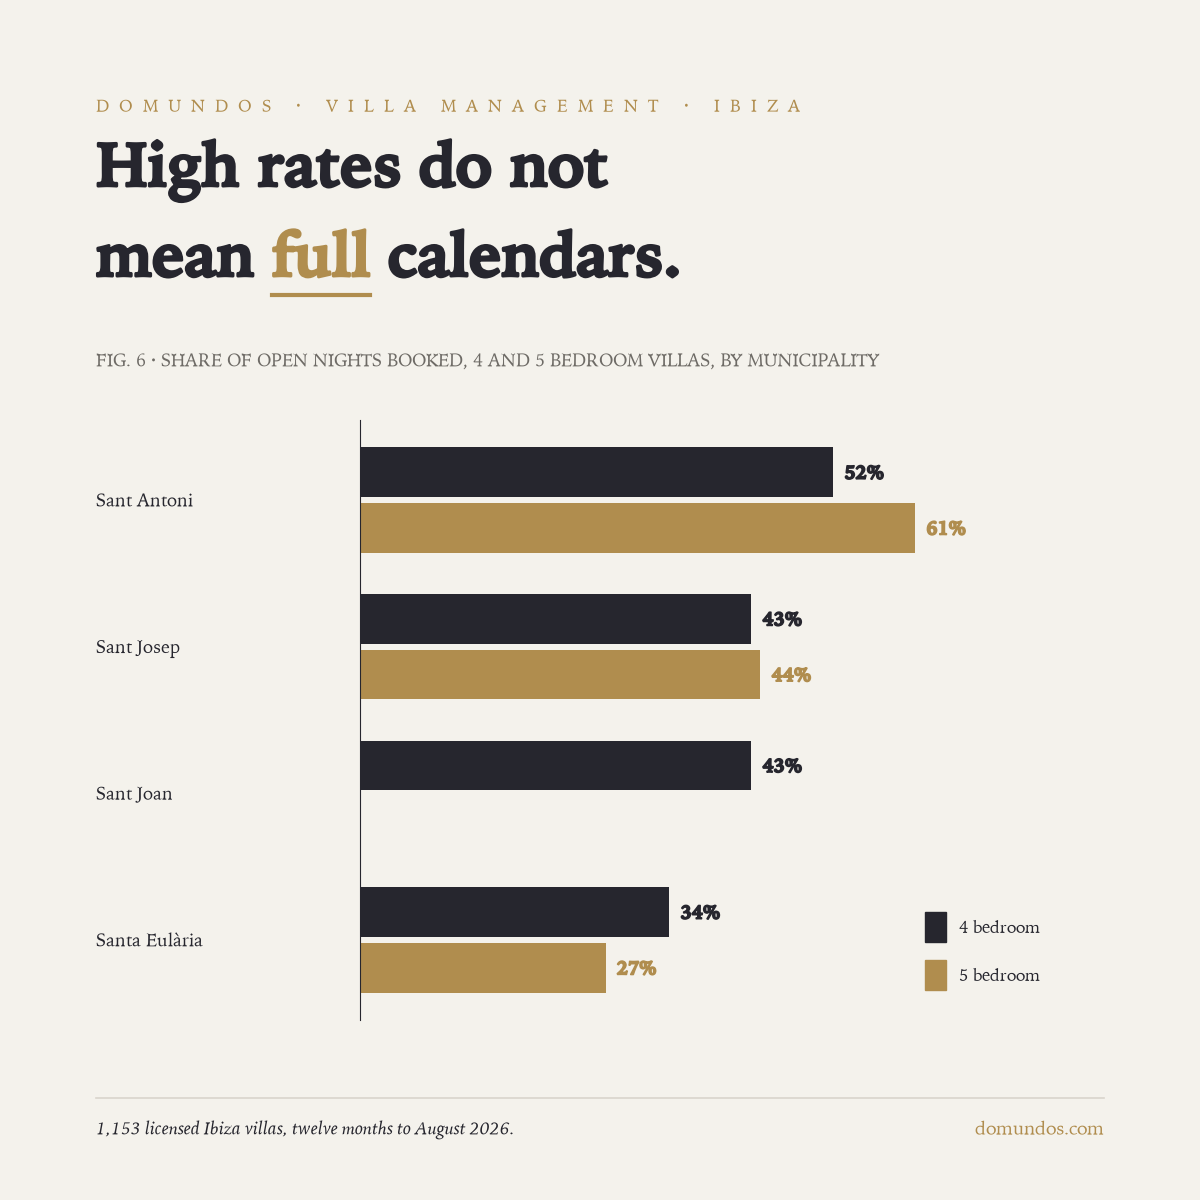
Occupancy varies more by area than owners expect. Measured as the share of open nights actually booked, the medians are Sant Antoni 52% for four bedrooms and 61% for five, Sant Josep 43% and 44%, Sant Joan 43% at four bedrooms, Santa Eulària 34% and 27%. Santa Eulària combines the island’s highest five-bedroom peak rates with its emptiest calendars: spectacular houses, short seasons. The lesson for pricing is in Ibiza villa prices and yields.
The Seasonality Problem and Opportunity
Seasonality is the defining structural feature of the Ibiza rental market, and it cuts both ways. The concentration of income into a short peak window creates genuine upside, premium weekly rates during July and August that few European destinations can match, but it also creates structural fragility that owners frequently underestimate.
The majority of annual rental income for most Ibiza villas is generated across eight to twelve weeks between late June and early September. Fixed costs, such as management, maintenance, utilities, insurance, staffing, and compliance overhead, run for fifty-two weeks. If a villa underperforms for even two or three peak weeks due to poor pricing decisions, a management failure, a bad review from the previous season, or an operational issue that forces cancellations, the impact on annual results is immediate and largely irreversible. There is no Q4 recovery mechanism in this model.
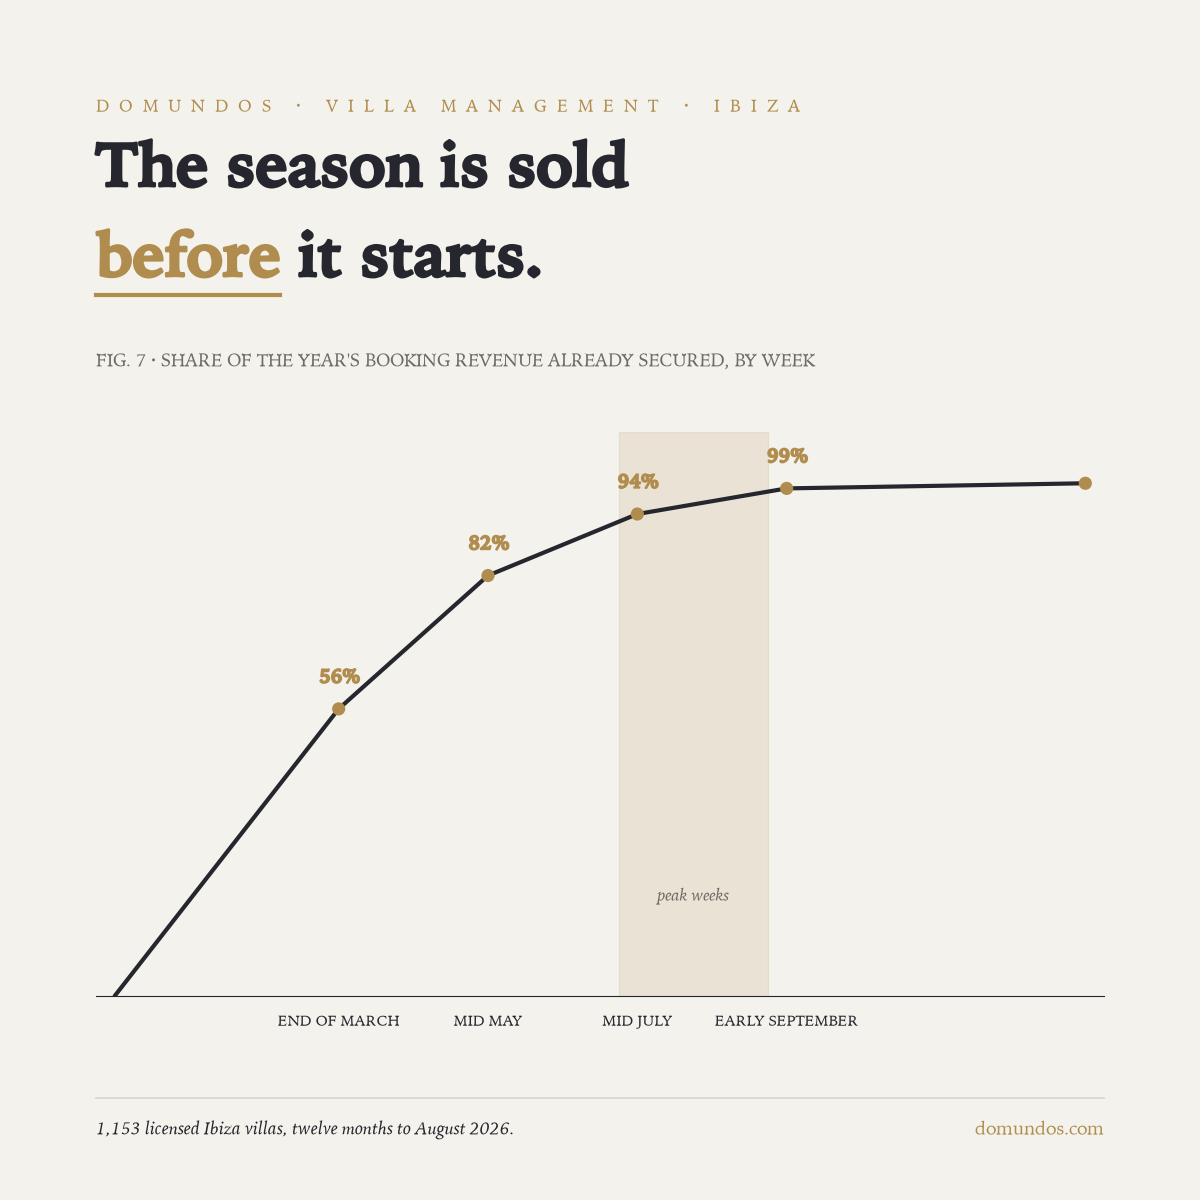
The booking curve makes the point: across the dataset 56% of the year’s revenue is already secured by the end of March, 82% by mid-May and 94% by mid-July. Peak weeks are committed months in advance by the guests who plan early and pay full rates. Availability in August is a signal that positioning, pricing or reputation has failed, not an opportunity, and in 2026 we saw last-minute gaps become much harder to fill than in earlier seasons while early bookings held their rates.
Shoulder season, May, early June, September, and increasingly October, represents the growth opportunity for owners looking to extend annual income beyond the compressed peak. Santa Eulària and central locations like Santa Gertrudis consistently achieve longer effective seasons than more specialist locations because their guest appeal is broader. A west-coast villa positioned entirely around the sunset experience will always be more seasonally concentrated than a centrally located villa that works for families in June and couples in September.
Gross vs Net: The Comparison Every Owner Needs to Make
This is the calculation that changes the conversation. Here is what realistic gross-to-net looks like across villa tiers in today’s Ibiza market, based on what we see operating properties on the island:
| Villa | Median gross income | Top quartile | Operating costs | Net income (median, at 30% costs) | Net yield at typical price |
|---|---|---|---|---|---|
| 3 bedrooms | €64,000 | €96,000 | 20% to 40% | €45,000 | 3.0% at €1.5M |
| 4 bedrooms | €91,000 | €125,000 | 20% to 40% | €64,000 | 2.8% at €2.25M |
| 5 bedrooms | €111,000 | €164,000 | 20% to 40% | €78,000 | 2.6% at €3.0M |
| 6 bedrooms | €130,000 | €214,000 | 25% to 40% | €91,000 | 2.3% at €4.0M |
Operating costs in these figures include management fees, cleaning and linen services, pool and garden maintenance, routine and emergency repairs, utilities during occupied periods, insurance, compliance costs, and periodic reinvestment in soft furnishings and equipment. They do not include financing costs, Spanish income tax, or major capital expenditure.
The 20% to 40% cost range is wide because the variables are real. A large villa with extensive grounds, high turnover, and premium concierge services costs meaningfully more to run than a compact, efficiently designed property with a lower maintenance footprint. Management quality also directly affects the cost side: preventative maintenance, efficient contractor relationships, and disciplined operational processes reduce long-term costs in ways that reactive management does not.
What these figures show clearly is that Ibiza villa ownership is not a high-yield investment in the conventional sense. Against typical 2026 purchase prices the median villa nets between 2% and 3%; only top-quartile operations reach 4% to 4.5%. The full yield arithmetic is in Ibiza villa prices and yields. That is the honest picture, and owners who plan around it make better decisions than those who plan around gross projections.
What Drives Outperformance
Within any location and price tier, performance variance between comparable villas is significant. The best-performing villa in a given area does not necessarily have the best views or the largest pool. It has the most disciplined operation. The factors that consistently drive outperformance are identifiable and, importantly, manageable:
- Full licensing compliance: unlicensed villas either cannot operate legally or operate under enforcement risk that creates instability
- Peak-season pricing accuracy: capturing full market rate during high-demand weeks rather than underpricing for early occupancy or overpricing into vacancy
- Reputation and review consistency: villas with strong review records convert enquiries at higher rates and command rate premiums over comparable but less-reviewed properties
- Operational reliability: guests who experience smooth check-ins, fast maintenance responses, and professionally managed stays become repeat bookers and direct referrers
- Shoulder-season strategy: villas that extend their effective season by two to four weeks annually generate materially better annual income without proportionally higher costs
The dataset puts numbers on those levers. Versus a comparable villa, needing an update costs about a third of revenue and no pool about 30%; a sea view adds about 18%, a high-luxury finish about 35%, and villas run professionally earn about 24% more than villas that are not. None of those is a location factor.
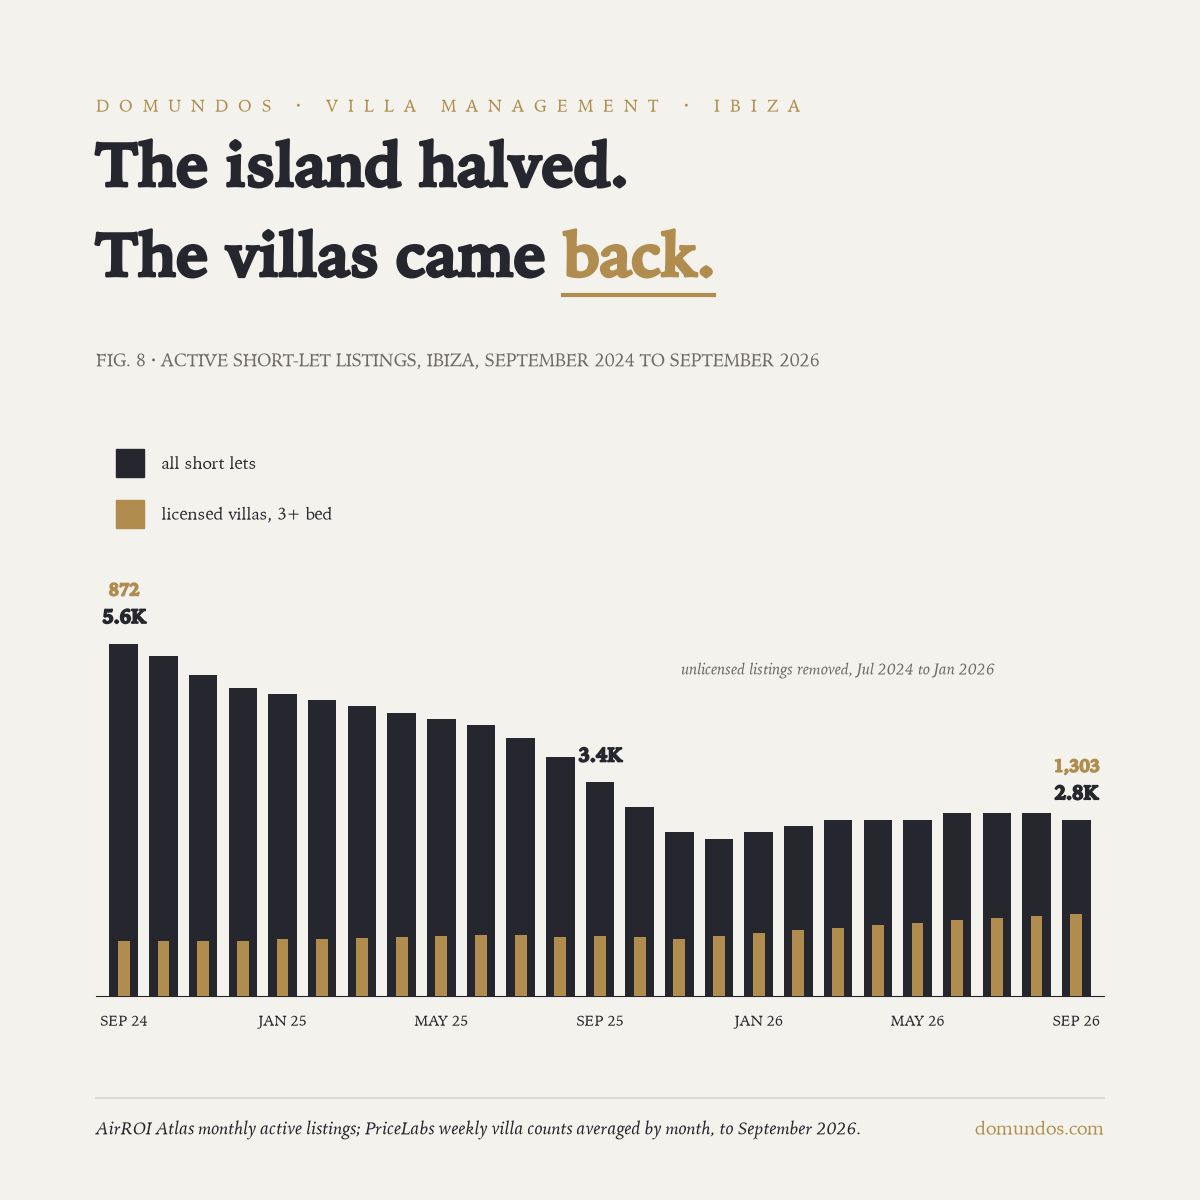
Supply is the long-term dimension. Our monthly market reports track active listings: island-wide short-let supply halved between 2024 and 2026 as unlicensed operators were removed, while licensed villas with three or more bedrooms rose from about 870 to 1,303. Sustained demand against constrained supply supports rate integrity for compliant, well-positioned owners: every enforcement action against an illegal rental is a reduction in competition for licensed villas.
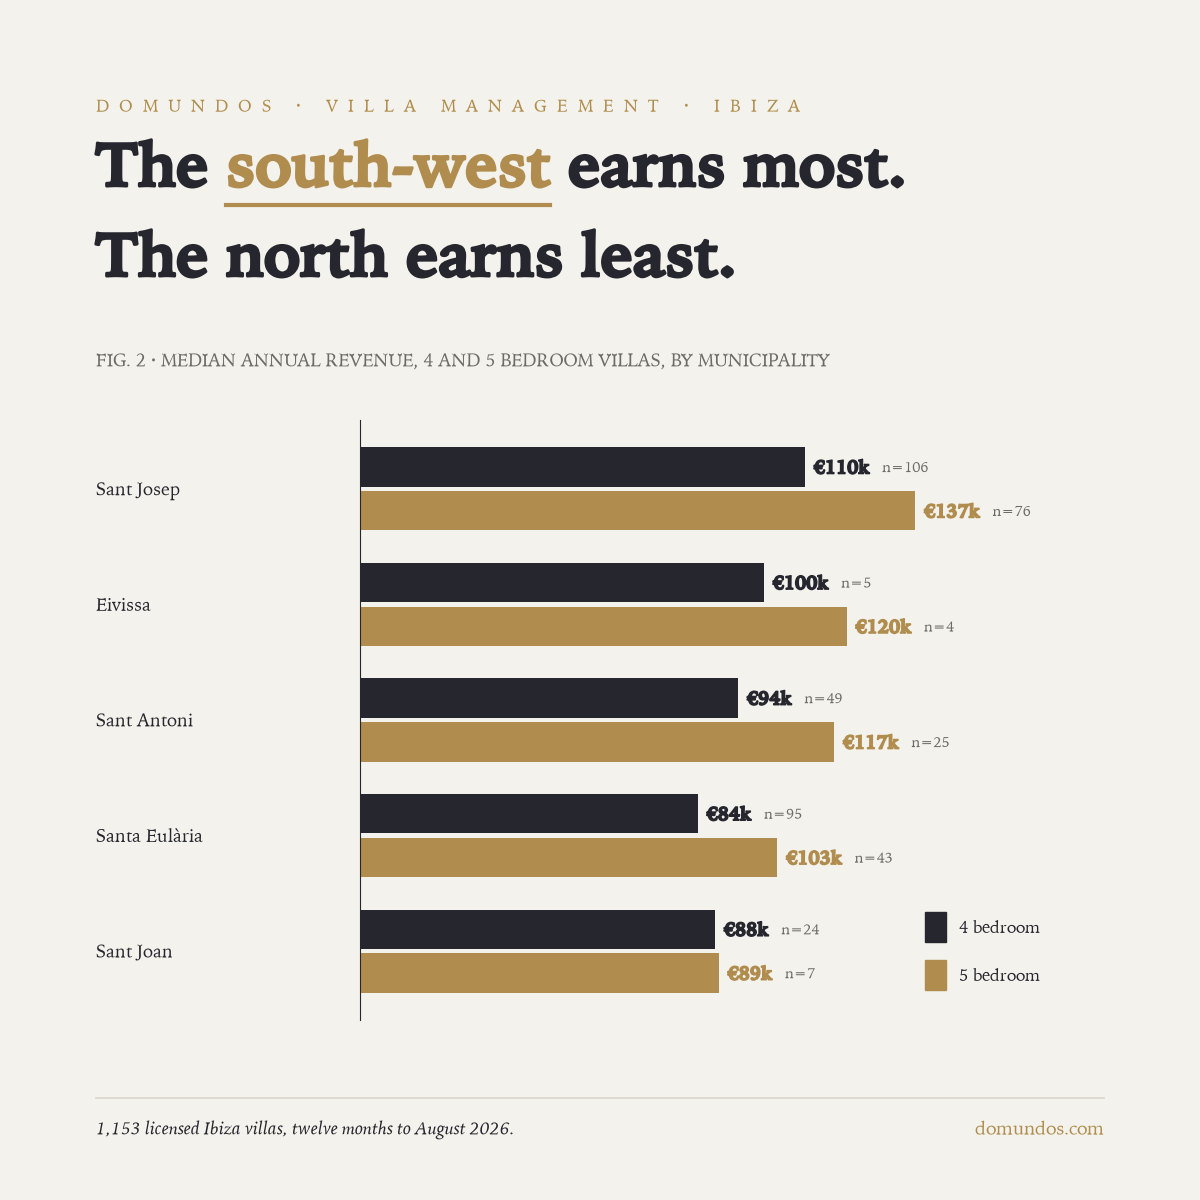
Revenue clusters where demand clusters. Sant Josep leads at every size, Eivissa and Sant Antoni follow, the north earns least; the area-by-area detail, and why a well-run villa in a cheaper municipality can beat a badly run one in Cala Jondal, is in Best areas and location.
Tracking Performance: What Good Reporting Looks Like
In a market where the difference between a strong and an average result is often a matter of pricing accuracy, booking window management, and cost control, performance tracking is how owners identify problems early enough to fix them and opportunities early enough to capture them, not administrative housekeeping.
Professional reporting should cover achieved rates versus market benchmarks for equivalent weeks, occupancy against seasonal targets, revenue broken down by booking channel, cost performance against budget, maintenance spend by category, and guest feedback trends. This information, delivered consistently and in a format that is genuinely readable, allows owners to make informed decisions rather than react to surprises at year end.
At Domundos, we provide owners with detailed performance reporting on a schedule that matches the rhythm of the rental season: more frequent during peak months when decisions need to be made quickly, summarised at end of season to inform the following year’s strategy. Our view is that an informed owner makes better decisions about their asset, which produces better outcomes for both parties. Opacity in management reporting is almost always a sign that performance is not something the management company wants examined closely.
Owners wanting to understand how rental income is taxed in Spain can consult the Spanish tax authority guidance on rental income declaration